Time To 'Sell In May'?
Cam Hui | Apr 29, 2013 03:32AM ET
As we approach the end of April, the inevitable question of seasonality arises. Is it time to sell in May and go away?
While many of my intermediate and long term technical indicators are starting to line up, indicating that it may be prudent to start selling now, I am not seeing the bearish trigger yet. To review, let's consider the charts from the three major regions of the world, US, Europe and China.
What does defensive leadership mean?
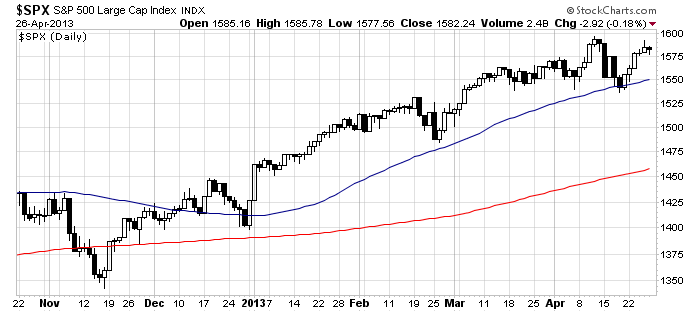
In the US, the stock market remains in an uptrend. The SPX, as shown below, remains in an uptrend and it is above both its 50 and 200 day moving average. For traders, it may be premature to get overly bearish without some catalyst or trigger.
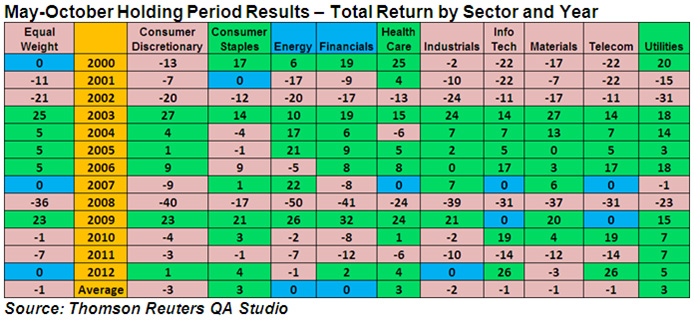
The warning signs are there. Defensive sectors have been leading the market. Analysis from Thomson-Reuters shows that the defensive sectors have fared the best in the May-October period during the 21st Century. Is the market anticipating a downturn or correction?
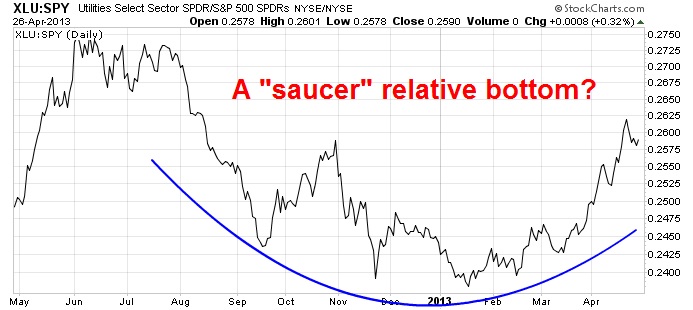
Consider the chart below of the relative performance of Utilities against the market. The sector appears to be making a saucer shaped relative bottom, which is an indication that the intermediate term outlook for relative performance is positive.
Similarly, look at the relative performance of Consumer Staples. The sector staged a relative upside breakout in late March and remains in a relative uptrend, though it got over-extended and pulled back last week.
As well, take a look at the relative performance chart of Healthcare. Like Consumer Staples, this sector staged a relative upside breakout in March and has also pulled back recently, though the relative breakout remains intact.
Meanwhile, cyclical stocks appear to be rolling over against the market. The chart below of the Morgan Stanley Cyclical Index against the market shows CYC to be failing at a relative resistance level and starting to roll over in relative performance.
The defensive vs. cyclical theme has also played out in the real estate sector. Consider the relative performance of the cyclically oriented homebuilding group, which was on a tear for all of last year, but is now consolidating sideways after violating a relative uptrend.
By contrast, the chart below of the relative performance of the more defensive and yield oriented REITs against the market shows that this group staged a relative upside breakout in early April, then pulled back a bit, but the relative breakout remains intact.
Premature to go short
Is it time to get bearish and get short the market? Not yet. I consider the US market to be at a crossroads. The rally last week was led by an oversold bounce in gold and other resource sectors. As the chart below shows, gold has rallied to mostly fill the gap from its recent freefall. We now need to watch if there is any follow through or if gold (and the stock market/risk-on trade) can continue upward from here.
Another bearish setup has been the relative performance of stocks to Treasuries. As the relative performance chart below shows, stocks remain in a minor relative downtrend to bonds after breaking down from a recent relative uptrend.
In addition, the longer term chart of the 10-year yield shows that bond yields remain in a downtrend and the recent uptick looks like a Qwest Investment Fund Management Ltd. ("Qwest"). This article is prepared by Mr. Hui as an outside business activity. As such, Qwest does not review or approve materials presented herein. The opinions and any recommendations expressed in this blog are those of the author and do not reflect the opinions or recommendations of Qwest.
None of the information or opinions expressed in this blog constitutes a solicitation for the purchase or sale of any security or other instrument. Nothing in this article constitutes investment advice and any recommendations that may be contained herein have not been based upon a consideration of the investment objectives, financial situation or particular needs of any specific recipient. Any purchase or sale activity in any securities or other instrument should be based upon your own analysis and conclusions. Past performance is not indicative of future results. Either Qwest or Mr. Hui may hold or control long or short positions in the securities or instruments mentioned.
Trading in financial instruments and/or cryptocurrencies involves high risks including the risk of losing some, or all, of your investment amount, and may not be suitable for all investors. Prices of cryptocurrencies are extremely volatile and may be affected by external factors such as financial, regulatory or political events. Trading on margin increases the financial risks.
Before deciding to trade in financial instrument or cryptocurrencies you should be fully informed of the risks and costs associated with trading the financial markets, carefully consider your investment objectives, level of experience, and risk appetite, and seek professional advice where needed.
Fusion Media would like to remind you that the data contained in this website is not necessarily real-time nor accurate. The data and prices on the website are not necessarily provided by any market or exchange, but may be provided by market makers, and so prices may not be accurate and may differ from the actual price at any given market, meaning prices are indicative and not appropriate for trading purposes. Fusion Media and any provider of the data contained in this website will not accept liability for any loss or damage as a result of your trading, or your reliance on the information contained within this website.
It is prohibited to use, store, reproduce, display, modify, transmit or distribute the data contained in this website without the explicit prior written permission of Fusion Media and/or the data provider. All intellectual property rights are reserved by the providers and/or the exchange providing the data contained in this website.
Fusion Media may be compensated by the advertisers that appear on the website, based on your interaction with the advertisements or advertisers.